The following guest post was written by Mike Petroff, digital content strategist, Harvard University.

Content strategy typically starts with planning for and managing content on your own website. Words, images, videos, and other elements all fit within your carefully constructed design.
But, what happens when people discover your content in spaces like Facebook and Twitter? How can we prepare our content to visually stand out when it extends into social media, facing endless competition?
It’s all about metadata. By accounting for it in our content planning, we can control how our web content displays in the all-powerful social news feed.
Facebook Open Graph
Facebook’s Open Graph protocol, introduced in 2010, “enables any web page to become a rich object in a social graph.” Adding Open Graph tags in your HTML code allows Facebook to carry over important elements of your web content into the News Feed. Items that should be identified include a title, site name, URL, short description, and image.
Both editorial guidelines and technical implementation must be part of your process. Editorially, think about the titles and descriptions you include with your story metadata. What type of interaction do you want to generate from your audience? Clicks? Shares? Determine the reason why someone should connect with your story when scrolling through the social feed.
Also, consider images and sizing (Facebook recommends an image of at least 1200x630px in size). Images have the most real estate in a link post, so make them count. Here’s a tip: Create a Facebook Interest list related to your topic area, add Pages with high engagement, and research how they take advantage of titles and images in link posts.
On the technical side, decide how you will generate the Open Graph code and how website editors can assign content to those fields. Should a webpage title always feed the og:title field? What technical considerations need to be made for images? Technical and editorial teams should work together to develop these processes, but also allow for flexibility to adapt to social platform updates and API changes.
How to Add Facebook Open Graph Tags
First, review Facebook’s tips on setting up Open Graph tags on your website. If you’re on WordPress, there are plugins available that can get you started. Drupal modules are also available. Once you’ve implemented Facebook Open Graph tags, you can test them using Facebook’s Debugger tool.
A Facebook News Feed link preview, from a Harvard Gazette story:

Why Facebook Open Graph is Important for Sharing
Facebook continues to emphasize metadata-rich link posts as the preferred method for publishers to share content. From Facebook, posted in August 2014:
We’ve found that people often prefer to click on links that are displayed in the link format (which appears when you paste a link while drafting a post), rather than links that are buried in photo captions. The link format shows some additional information associated with the link, such as the beginning of the article, which makes it easier for someone to decide if they want to click through. This format also makes it easier for someone to click through on mobile devices, which have a smaller screen.
Twitter Cards
Twitter Cards, like Facebook’s Open Graph, use HTML metadata to generate previews of your web content within a Tweet. Several Twitter Card types are available, including Summary Cards, Summary Cards with a Large Image, Photo Cards, Gallery Cards, and more.
How to Add Twitter Cards
First, choose the Card type you’d like to implement. Most publishers should start with Summary Cards, which include a title, description, image thumbnail, and Twitter account attribution. Then, review the metadata needed in your website code to generate a Twitter Card. Once you’ve added the code, go to the Cards validator tool to test and request that your Card be whitelisted by Twitter.
A Twitter Card example, from a Harvard Gazette story:

How Twitter Cards Impact Engagement
Tweets are not expanded by default in the Timeline, so in order to see a Twitter Card, a Twitter user must either expand the tweet or visit the Tweet’s permalink. But, there are other cases in which Twitter Cards can make a big impact in your engagement.
Pinned Tweets: By default, a pinned Tweet will expand to show a Twitter Card or attached media.
In an experiment to test the affect Twitter Cards had on engagement, Buffer found the following for pinned Tweets:
Our pinned Twitter card received 359 leads. A standard Twitter card that we posted without pinning collected 36 leads. That’s a 10x difference in conversions!
Embedded Tweets: Tweets embedded on websites display as expanded by default, showing rich content included in the Twitter Card. By implementing Twitter Cards, you immediately increase the amount visual content that is included in a Tweet embed.
Consider areas within your website that may benefit from embedded tweets. Tweets with Vines can be embedded to add short videos. Embedding user-generated content through tweets can broaden your brand’s voice. Extend the conversation around a post by embedding a Tweet with a discussion prompt.
Measuring Impact
Once you’ve added metadata and have optimized your content for the social feed, it’s time to measure how those changes impact your traffic. How do you measure your ‘owned’ traffic (traffic generated from your own accounts and email lists) against ‘earned’ traffic, like organic traffic from social media? A larger goal is likely increased traffic, but are you seeing the right audience interacting with your site after discovering content in the social feed? Here are some ways to implement URL tagging to identify traffic more clearly in Google Analytics.
Using Analytics to Measure Earned vs. Owned
For all posts coming from your own social media channels, add UTM tagging to identify key components in Google Analytics. Find a structured way of adding a Campaign Source, Campaign Medium, and Campaign Name for each channel and campaign, and distribute that structure to other groups around your institution. Here’s an example:
Campaign Medium: Email, Social, etc. (most broad)
Campaign Source: Facebook, Twitter, etc. (identifies the social channel)
Campaign Name: Include a way to identify the office, and specific information about the campaign
Using that structure, your URLs may look like this:
She made her mark
The Campaign Name identifies hu_, or ‘Harvard University’ here, but acronyms could be used for groups like Admissions, Alumni, and other offices.
In Google Analytics, you can identify this traffic in the Acquisition > Campaigns area:
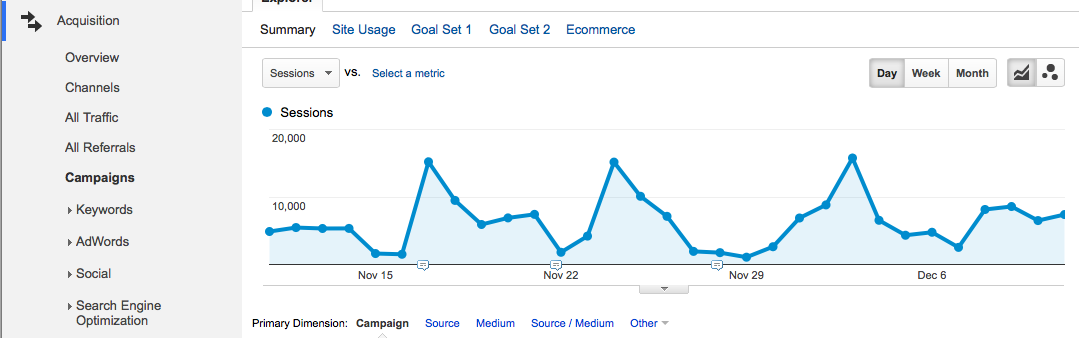
Once you have your ‘owned’ traffic identified, you can exclude this traffic and identify referral, or ‘earned’ traffic from social socials, with more precision.
Presentation Matters
“Go where your audience is.” It’s a common phrase we’ve all heard. Planning, structuring, and optimizing your website’s metadata allows your content to travel smoothly into the social platforms that dominate our audience’s time. A List Apart outlined the importance of these steps in 2013, and editorial teams must continue to work with technical teams as social platforms rely more and more on web content to bring users back. Schools like Bob Jones University and Duke University are taking steps to consider the integration of metadata and social sharing into their editorial process. Think about how you can make your content travel that extra mile, too.
For live social media feeds aggregation, there is http://www.dialogfeed.com.
It displays social media contents on a social wall to embed on website. Or provides you with data feed in XML or JSON.